esxtop Guide
11 Jul 2011 by Simon Greaves
Someone once likened esxtop to windows task manager on steroids. When you have a look at the monitoring options available you can see why someone would think that.
esxtop is based on the ‘nix top system tool, used to monitor running applications, services and system processes. It is an interactive task manager that can be used to monitor the smallest amount of performance metrics of the ESX(i) host. esxtop works on ESX and it’s cousin remote esxtop or resxtop is for ESXi, although resxtop will work on ESX as well.
To run esxtop from ESX all you need to do is type esxtop from the command prompt.
To run resxtop you need to setup a vMA appliance and then run resxtop --server and enter the username and password when prompted. You don’t need root access credentials to view resxtop counters, you can use vCenter Server credentials.
The commands for esxtop and resxtop are basically the same so I will describe them as one.
Monitoring with resxtop collects more data than monitoring with esxtop so CPU usage may be higher. This doesn’t mean this esxtop isn’t resource intensive, quite the opposite. In fact it can use quite a lot of CPU cycles when monitoring in a large environment, if possible limit the number of fields displayed. Fields are also known as columns and entities (rows) You can also limit the CPU consumption by locking entities and limiting the display to a single entity using l.
esxtop uses worlds and groups as the entities to show CPU usage. A world is an ESX Server VMkernel schedulable entity, similar to a process or thread in other operating systems. It can represent a virtual machine, a component of the VMkernel or the service console. A group contains multiple worlds.
Counter values
esxtop doesn’t create performance metrics, it derives performance metrics from raw counters exported in the VMkernel system info nodes. (VSI nodes) esxtop can show new counters on older ESX systems if the raw counters are present in VMkernel. (i.e. 4.0 can display 4.1 counters)
Many raw counters have static values that don’t change with time. A lot of counters increment monotonically, esxtop reports the delta for these counters for a given refresh interval. For instance the counters for CMDS/sec, packets transmitted/sec and READS/sec display information captured every second.
Counter normalisation
By default counters are displayed for the group, in group view the counters are cumulative whereas in expanded view, counters are normalised per entity. Because of the cumulative stats, percentage displayed can often exceed 100%. To view expanded stats, press e.
Snapshots
esxtop takes snapshots. Snapshots are every 5 seconds by default. To display a metric it takes two snapshots and makes a comparison of the two to display the difference. The lowest snapshot value is 2 seconds. Metrics such as %USED and %RUN show the CPU occupancy delta between successive snapshots.
Manual
The manual for (r)esxtop is full of useful examples, and unlike normal commands run on ESXi it will work if you run it from the vMA in the same way that it does from ESX.
To use just type
man esxtop
or
man resxtop
Commands
Commands for (r)esxtop can be split into two distinct types, running commands and interactive commands
Running commands
These are commands that get placed at the end of the initial call of (r)esxtop.
Example
esxtop -d 05
This command would set a delay on the refresh rate of 5 seconds.
Running commands examples
-d - sets delay.
-o - sets order of Columns.
-b - batch mode - I will explain this in further detail below.
Interactive commands
These are commands that work on a key press once (r)esxtop is up and running. If in any doubt of which command to use just hit h for help.
Interactive commands examples
c - CPU resource utilisation.
m - memory resource utilisation.
d - storage (disk) adapter resource utilisation.
u - storage device resource utilisation.
v - storage VM resource utilisation.
f - displays a panel for adding or removing statistics columns to or from the current panel.
n - network resource utilisation.
h - help.
o - displays a panel for changing the order of statistics.
i - interrupt resource utilisation.
p - power resource utilisation.
q - quit.
s - delay of updates in seconds. (can use fractional numbers)
w - write current setup to the config file. (esxtop4c)
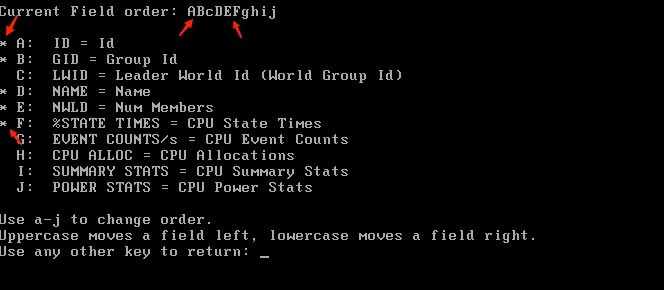
From the field selection panel, accessible by pressing o you can move a field to the left by pressing the corresponding uppercase letter and you can move a field to the right by pressing the corresponding lowercase letter. The currently active fields are shown in uppercase letters, and with an asterix to show it is selected in the order field selection screen.
Batch mode (-b)
Batch mode is used to create a CSV file which is compatible with Microsoft perfmon and ESXplot. For reading performance files ESXplot is quicker than perfmon. CSV compatibility requires a fixed number of columns on every row. Because of this reason statistics of vm (world) instances that appear after starting the batch mode are not collected. Only counters that are specified in the configuration file are collected. Using the -a option collects all counters. Counters are named slightly differently to be compatible with perfmon.
To use batch mode select the columns you want in interactive mode and then save with W, then run
esxtop -b -n 10 > esxtopfilename.csv
Options
-a - all.
-b - Batch mode.
-c - User defined configuration file.
-d - Delay between statistics snapshots. (minimum 2 seconds)
-n - Number of iterations before exiting.
To read the batch mode output file is to load it in Windows perfmon.
- Run perfmon
- Type “Ctrl + L” to view log data
- Add the file to the “Log files” and click OK
- Choose the counters to show the performance data.
esxtop reads it’s default configuration from a .esxtopp4rc file. This file contains 8 lines. The first 7 lines are upper and lowercase letters to specify which fields appear, default is CPU, memory, storage, adapter, storage device, virtual machine storage, network and interrupt. The 8th line contains other options. You can save configuration files to change the default view with in esxtop.
Replay mode
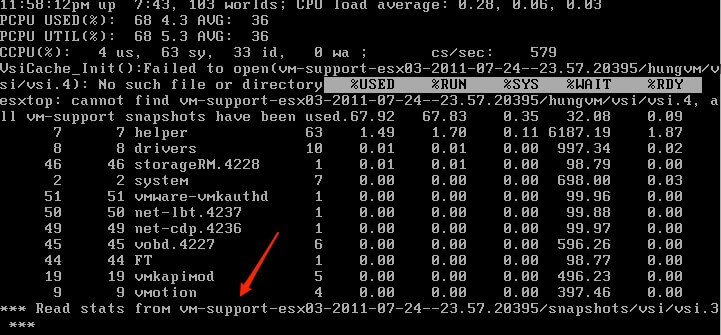
Replay mode interprets data that is collected by issuing the vm-support command and plays back the information as esxtop statistics. replay mode accepts interactive commands until no more snapshots are collected by vm-support. Replay mode does not process the output of batch mode.
To use replay mode run
vm-support -S -i 5 -d 60
untar the file using
tar -xf /root/esx*.tgz
then run
esxtop -R root/vm-support*
Commands
-S - Snapshot mode, prompts for the delay between updates, in seconds.
-R - Path to the vm-support collected snapshot’s directory.
CPU
CPU load average of 1.00 means full utilisation of all CPU’s. A load of 2.00 means the host is using twice as many physical CPU’s as are currently available, likewise 0.50 means half are being utilised.
For information on CPU Optimisation, check out my CPU Optimisation blog post.
CPU Screen
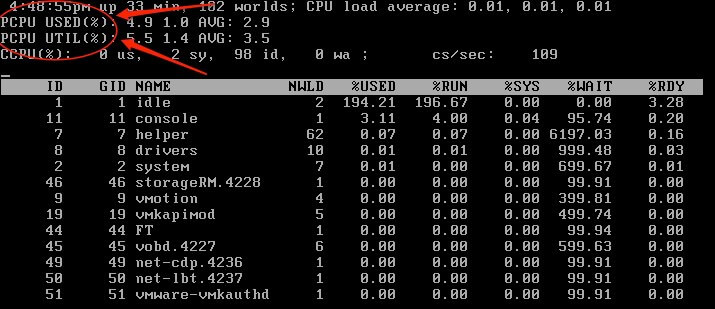
` PCPU USED(%)` - Physical hardware execution context. Can be a physical CPU core if hyperthreading is unavilable or disabled or a logical CPU (LCPU) or SMT thread if hyperthreading is enabled. This displays PCPU percentage of CPU usage when averaged over all PCPUs.
` PCPU UTIL(%)` - Physical CPU utilised. (real time) Indicates how much time the PCPU was busy, in an unhalted state, in the last snapshot duration. Might differ from PCPU USED(%) due to power management technologies or hyperthreading.
If hyper threading is enabled these figures can be different, likewise if the frequency of the PCPU is changed due to power management these figures can also be adjusted.
As an example if PCPU USED(%) is 100 and PCPU UTIL(%) is 50 this is because hyper threading is splitting the load across the two PCPUs. If you then look in the vSphere client you may notice that CPU usage is 100%. This is because the vSphere client will double the statistics if hyperthreading is enabled.
In a dual core system, each PCPU is charged by the CPU scheduler half of the elapsed time when both PCPUs are busy.
` CCPU(%) - Total CPU time as reported by ESX service console. (Not applicable to ESXi)
us - Percentage user time.
sy - Percentage system time.
id - Percentage idle time.
wa - Percentage wait time.
cs/sec` - Context switches per second recorded by the ESX Service Console.
CPU panel statistics (c)
Fields
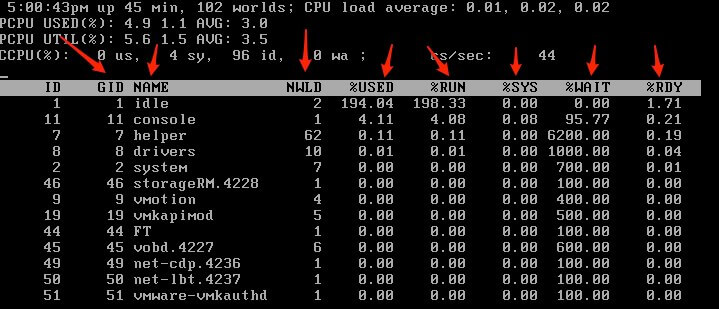
ID - resource pool or VM ID of the running worlds resource pool or VM or world ID of running world.
GID - Resource pool ID of the running worlds resource pool or VM.
NAME - err… name.
NWLD - Number of members in a running worlds resource pool or VM.
%USED - CPU core cycles used.
%RUN - CPU scheduled time.
%SYS - Time spent in the ESX(i) VMkernel on behalf of the resource pool, VM or world to processor interrupts.
%WAIT - Time spent in the blocked or busy wait state.
%RDY - Time CPU is ready to run, waiting for something else.
High %RDY and high %USED can imply CPU overcommitment.
Additional fields
%IDLE - As it says. Subtract this from %WAIT to see time waiting for an event. WAIT-IDLE can be used to estimate guest I/O wait time.
%MLMTD (max limited - Time VMkernel didn’t run because it would violate limit settings on the resource pool, VM or world limits setting.
%SWPWT - Wait time for swap memory.
CPU ALLOC - CPU allocation. Set of CPU statistics made up of the following. (For a world the % are the % of one physical CPU core)
AMIN - Attribute reservation.
AMAX - Attribute limit.
ASHRS - Attribute shares.
SUMMARY STATS - Only applies to worlds.
CPU - Which CPU esxtop was running on.
HTQ - Indicates whether a world is currently quarantined or not. (Y or N)
TIMER/s - Timer rate for this world.
%OVRLP - Time spent on behalf of a different resource pool/VM or world while the local was scheduled. Not included in %SYS.
%CSTP - Time the vCPUS of a VM spent in the co-stopped state, waiting to be co-started. This gives an indication of the co-scheduling overhead incurred by the VM. If this value is high and the CPU Ready time is also high, this represents that the VM has too many vCPUs. If low, then any performance problems should be attributed to other issues and not to the co-scheduling of the VM’s vCPU.
Single key display settings
e - expand. Displays utilisation broken down by individual worlds belonging to a resource pool or VM. All %’s are for individual worlds of a single physical CPU.
u - Sort by %USED column.
r - Sort by %RDY.
n - Sort by GID. (default)
v - VM instances only.
l - Length of NAME column.
CPU clock frequency scaling
%USED - CPU usage with reference to the base core frequency, i.e. the actual CPU value in Mhz.
%UTIL - CPU utilisation with reference to the current clock frequency. (displayed as %)
%RUN - Total CPU scheduled time. Displayed as %. If using turbo boost will show greater than 100%.
%UTIL may be different if turbo boost in enabled. To better define this, if a CPU has a base core clock speed of 1Ghz, with turbo boost is 1.5Ghz then %USED (with turbo boost enabled) is 150%. So the current CPU speed (%UTIL) will be that 150% displayed as a value of 100%. Now if the current used CPU is 1Ghz then the current %UTIL will be 50% and not 100%. (as per the base core frequency) Consider this when monitoring these stats.
Interrupt panel (i)
VECTOR - Interrupt vector ID.
COUNT/s - Interrupts per second on CPU x
TIME/int - Average processing time per interrupt. (in micro seconds)
TIME_x - Average processing time on CPU. (in micro seconds)
DEVICES - Devices that use the interrupt vector. If the interrupt vector is not enabled name is in < > brackets.
Memory
The following counters and statistics assume a basic understanding of memory management in a virtualised environment. Check out my Understanding virtual machine memory guide for a brief overview of memory management and my virtual machine memory guide.
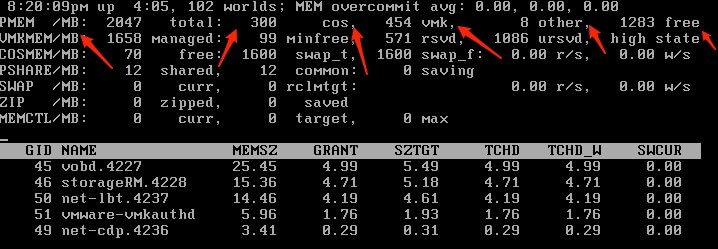
Memory screen (m)
PMEB(MB) - Machine memory statistics.
Total - Yup you guessed it, total.
COS - Amount allocated to the service console.
VMK - Machine memory being used by the ESX(i) VMkernel.
Other - Everything else.
Free - Machine memory free
VMKMEM(MB) - Statistics for VMkernel in MB.
Managed - Total amount.
Min free - Minimum amount of machine memory VMKernel aims to keep free.
RSVD - Reserved by resource pools.
USVD - Total unreserved.
State - Values are high, soft, hard, low. (Pressure states)
COSMEM(MB) - Statistics as reported by the service console.
Free - Amount of idle memory.
Swap_t - Total swap configured.
Swap_f - Swap free.
r/s is - Rate at which memory is swapped in from disk.
w/s - Rate at which memory is swapped to disk.
NUMA(MB) - Only if running on a NUMA server.
PSHARE (MB) - Page sharing.
shared - Shared memory.
common - Across all worlds.
saving - Saved due to transparent page sharing.
SWAP(MB)
curr - Current.
target - What the ESX(i) system expects the swap usage to be.
r/s - swapped from disk.
w/s - swapped to disk.
MEM CTL(MB) - Balloon statistics.
curr - Amount reclaimed.
target - Host attempt reclaims using the balloon driver, vmmemctl.
max - Maximum amount the host can reclaim using vmmemctl.
Fields
AMIN - Memory reservation.
AMAX - Memory limit. A value if -1 means unlimited.
ASHRS - Memory shares.
NHN - Current home node for resource pool or VM. (NUMA only)
NRMEM (MB) - Current amount of remote memory allocated. (NUMA only)
N% L - Current % of memory allocated to the VM or resource pool that’s local.
MEMSZ (MB) - Amount of phyiscal memory allocated to a resource pool or VM.
GRANT (MB) - Guest memory mapped.
SZTGT (MB) - Amount the VMkernel wants to allocate.
TCHD (MB) - Working set estimate.
%ACTV - % guest physical memory referenced by the guest.
%ACTVS - Slow moving version of the above.
%ACTVF - Fast moving.
%ACTVN - Estimation. (This is intended for VMware use only)
MCTL - Memory balloon drive installed or not. (Y/N)
MCTLSZ (MB) - Amount of physical memory reclaimed by ballooning.
MCTLTGT (MB) - Attempts to reclaim by ballooning.
MCTLMAX (MB) - Maximum that can be reclaimed by ballooning.
SWCUR (MB) - Current swap.
Interactive
m - Sort by group mapped column.
b - sort by group Memch column.
n - sort by group GID column. (Default)
v - Display VM instances only.
l - Display length of the NAME column.
Network
The network stats are arranged per port of a virtual switch.
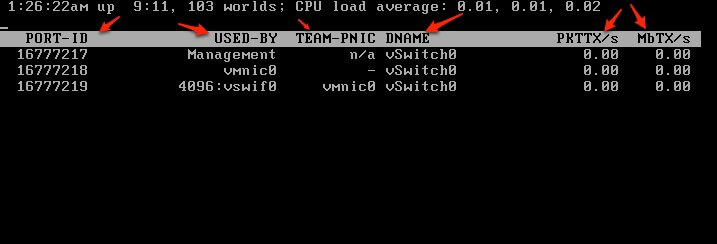
PORT-ID identifies the port and DNAME shows the virtual switch name. UPLINK indicates whether the port is an uplink. If the port is an uplink, i.e., UPLINK is 'Y', USED-BY shows the physical NIC name. If the port is connected by a virtual NIC, i.e., UPLINK is 'N', USED-BY shows the port client name.
Network panel (n)
Fields
PORT-ID - Port ID.
UPLINK - Uplink enabled.(Y or N)
UP - Guess what.
SPEED - Link in MB.
FDUPLX - Full duplex.
USED-BY - VM device port user.
DTYP - Virtual network device type. (H=hub, S=switch)
DNAME - Device name.
Interactive
T - Sort by Mb transmitted.
R - Sort by Mb received.
t - Packets transmitted.
r - Packets received.
N - Port-ID. (default)
L - Length of DNAME column.
Storage
Storage Panels
d - disk adapter.
u - disk device. (also includes NFS if ESX(i) host is 4.0 Update 2 or later)
v - disk VM.
An I/O request from an application in a virtual machine traverses through multiple levels of queues, each associated with a resource of some sort, whether that is the guest OS, the VMkernel or the physical storage. Each queue has an associated latency.
esxtop shows the storage statistics in three different screens; the adapter screen, device screen and vm screen.
By default data is rolled up to the highest level possible for each screen. On the adapter screen the statistics are aggregated per storage adapter by default, but the can be expanded to display data per storage channel, target, path or world using a LUN.
On the device screen statistics are aggregated per storage device by default and on the VM screen, statistics are aggregated on a per-group basis. One VM has one corresponding group, so they are equivalent to per-vm statistics. Use interactive command V to show only statistics related to VMs.
Queue Statistics
AQLEN - The storage adapter queue depth.
LQLEN - The LUN queue depth.
WQLEN - The World queue depth.
ACTV - The number of commands in the ESX Server VMKernel that are currently active. QUED The number of commands queued.
LOAD - The ratio of the sum of VMKernel active commands and VMKernel queued commands to the queue depth.
%USD - The percentage of queue depth used by ESX Server VMKernel active commands.
%USD = ACTV / QLEN * 100%

I/O throughput statistics
CMDS/s - Number of commands issued per second.
READS/s - Number of read commands issued per second.
WRITES/s - Number of write commands issued per second.
MBREAD/s - MB reads per second.
MBWRTN/s - MB written per second.
I/O latencies
I/O latencies are measured per SCSI command so it is not affected by the refresh interval. Reported latencies are average values for all the SCSI commands issued within the refresh interval window. Reported average latencies can be different on different screens, (adapter, LUN, VM) since each screen accounts for different group of I/O’s.
Latency statistics
This group of counters report latency values. These are under the labels GAVG, KAVG and DAVG. GAVG is the sum of DAVG and KAVG.
KAVG+DAVG=GAVG
GAVG - round-trip latency that the guest sees for all IO requests sent to the virtual storage device.(should be under 25)
KAVG - latencies due to the ESX Kernel’s command. should be small in comparison to DAVG DAVG latency seen at the device driver level. includes the roundtrip time between the HBA and the storage. (should be 2 or less)
QAVG - average queue latency. QAVG is part of KAVG (should be zero)
Storage adapter
CID - Channel ID.
TID - Target ID.
LID - LUN ID.
Interactive
e - Expand/rollup storage adapter statistics.
p - Same as e but doesn’t roll up to adapter statistics.
a - Expand/rollup storage channel statistics.
t - Expand/rollup storage target statistics.
r - Sort by READ/s.
w - Sort by WRITES/s.
R - sort by MBREADS/s.
T - Sort by MBWRTN/s.
Further information can be found at Duncan Eppings blog and in the excellent VMware communities post on Interpreting esxtop Statistics.
Tagged with: vSphere Command Line
Comments are closed for this post.